|
Veritus Ltd. |
|
| "...does not require extensive
training to understand or apply the results of the present- ation." |
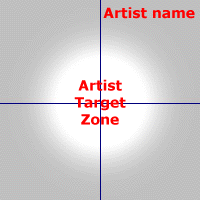
This section provides the keys to the information necessary to understand Veritus data presentation. The raw data obtained during the examination of a painting is filtered and collated. This information is then translated into data points. Veritus elected to use the data point format because this format is most easily decoded through non-technical human interaction. Veritus desires for the results of its technological investigation to be as unambiguous and user-friendly as possible. To this end personnel at insurance companies and banks, as well as jurists, auction houses, gallerists and collectors do not require extensive training to either understand or apply the results of the graphic presentations. Information is presented graphically as Individual Data Points (IDP) in what Veritus identifies as a Designated Artist's Target Zone (DATZ). The artist's name always appears in the upper right corner of the graphic describing the DATZ. The sample DATZ is the white area marked in red "Artist Target Zone" on the sample graphic that appears below. Digital information is collected then filtered, collated and converted into IDP. These IDP will form a pattern called a Data Point Distribution (DPD). The DPD is then compared to the known DATZ for various artists to determine the indisputable authorship of the painting. The DATZ is defined as a white area which fades into gray. The area that appears in white is the definitive area of the given artist. The fading gray area represents a proportional loss of confidence for attribution. The area in solid gray represents areas of confidence that exist for other artists. Thus, a convergence of points in a target zone establishes the attribution. |

|
It is also very important for the viewer to recognize that Veritus uses a sophisticated algorithm to proportionally compress areas outside the DATZ. This compression begins at the start of the fade to gray. Veritus compresses the graphic to facilitate evaluation by the viewer. If compression was not used, many IDP outside the DATZ would not appear on the graphic. Even with compression many IDP still fall outside of the graphic. Thus, an IDP that appears to be only a short distance from the DATZ is actually significantly farther away than is apparent. The greater the distance from the DATZ, the proportionately greater the compression of visible space. The graphic appearing to the immediate left shows a full graphic without compression that is reduced to a size so that the external dimensions are the same as the proceeding graphic. The reference lines are removed since they would mask the DATZ for the viewer. |